Numerical-simulation-of-deep-foundation-pit-dewatering-and-optimization-of-controlling-land
Numerical simulation of deep foundation pit dewatering and optimization of controlling land subsidence
Nianqing Zhou a ,b ,?,Pieter A.Vermeer b ,Rongxiang Lou c ,Yiqun Tang d ,Simin Jiang a
a
Department of Hydraulic Engineering,Tongji University,Shanghai 200092China
b
Institute of Geotechnical Engineering,University of Stuttgart,70569Stuttgart,Germany c
Shanghai Guanglian Construction Development Co.Ltd.,Shanghai 200438,China d
Department of Geotechnical Engineering,Tongji University,Shanghai 200092China
a b s t r a c t
a r t i c l e i n f o Article history:
Received 13August 2009
Received in revised form 1May 2010Accepted 8May 2010
Available online 27May 2010
Keywords:
Dewatering of the deep foundation pit Pumping tests
Underground continuous concrete wall Parameter inversion Numerical simulation Land subsidence
Shanghai is a typical area of soft soil distribution,Metro railway construction is now being developed in Shanghai City on a large scale and the planning of Metro stations are often located in densely populated districts with tall buildings.Metro station constructions are mostly taking pit dewatering measures,while the dewatering of aquifer may cause soil layer compression,land subsidence,foundation's deformation,cracking and tilting of the buildings,and so on.In order to control the land subsidence effectively,the underground continuous concrete wall is often used in the deep foundation pit dewatering.The depth of underground continuous concrete wall and the ?lter tube position of pumping well affect drawdown outside the pit and land subsidence directly.This study refers to the deep foundation pit dewatering project of Hangzhong Road station of Shanghai Metro Line No.10.The excavation depth of foundation pit is 15.60–17.60m,and the design depth of underground continuous wall is 28m in the standard part and 30or 31m in the end well.Three-dimensional ?nite differences method is used to simulate the pit dewatering through the inversion of permeability parameters based on the ?eld pumping tests.The hydraulic barrier function of the underground continuous wall is simulated at four different depths including primary design depth,increasing 3m,4m and 6m.The result of the numerical simulation indicates that the drawdown of the aquifer decreases with the increase of the underground continuous concrete wall depth.When the underground continuous concrete wall increases 4m on primary design basis,the drawdown outside the pit and land subsidence can be controlled effectively.The monitored results indicate that the drawdown outside the pit at a distance of 1–5m to the wall is less than 2m,while the maximum land subsidence is 7.97mm,which is of nearly no in ?uence on the environment around the pit during dewatering.
?2010Elsevier B.V.All rights reserved.
1.Introduction
Shanghai is one of the most economically developed cities in China.In recent years,with the rapid development of the national economy and the continuous expansion of urban construction,the development of underground space has received more and more attention.Metro construction is an important way of development and utilization of underground space.Metro station construction is often requiring dewatering measures.Water in ?ow and drawdown are the most care requiring in the construction.In order to calculate water in ?ow of pit,numerical methods are often used.Based on the two dimensional ?nite element method,the seepage ?eld and penetrating ?ow at different stages of the pit construction were analyzed (Yu et al.,2002).The seepage near the hydraulic barrier was
studied with two dimensional ?nite element method (Wang et al.,2001).The con ?ned aquifers of high head are buried below the base of foundation pit,dewatering is exceedingly easy to make a dramatic decrease of the underground water level surrounding the dewatering area and cause land subsidence and geologic disasters (Luo et al.,2008a,b;Wang et al.,2009).According to the different positions of the bottom of the underground continuous wall in an aquifer,three types of seepage around the foundation pit were proposed (Wu et al.,2003,2009).Therefore,based on the characteristics of three-dimensional geological body,it has become a priority to design rationally the entire engineering structures of dewatering,if economic and technological conditions are available,so that the demand of decrease of the underground water level in deep foundation pits can be met and meanwhile the decrease of the underground water level around foundation pit is incapable of causing land subsidence and geologic disasters.
Dassargues et al.(1991)once studied geotechnical properties of the Quaternary sediments in Shanghai.There are many scholars who
Engineering Geology 114(2010)251–260
?Corresponding author.Department of Hydraulic Engineering,Tongji University,Shanghai 200092China.
E-mail address:nq.zhou@https://www.docsj.com/doc/8512302985.html, (N.
Zhou).0013-7952/$–see front matter ?2010Elsevier B.V.All rights reserved.
Contents lists available at ScienceDirect
Engineering Geology
j o u rn a l h o m e p a g e :w ww.e l s evi e r.c o m /l o c a t e /e n g g e o
studied the pit dewatering and land subsidence(Burbey,2003;Shi et al.,2008;Thomas and Holzer,1989;Hawkins,2005;Zhang et al., 2007),their achievements can provide much help in the study of pit dewatering of Hangzhong Road station of Shanghai Metro No.10.
The main objectives of this paper are:(1)to calculate hydro-geologic parameters of aquifer based on the pumping tests;(2)to simulate groundwater level at different depths of underground continuous concrete wall during dewatering;(3)to calculate the maximum land subsidence at different distances away from the foundation pit;(4)to optimize dewatering model of deep pit and control land subsidence.
2.Engineering background
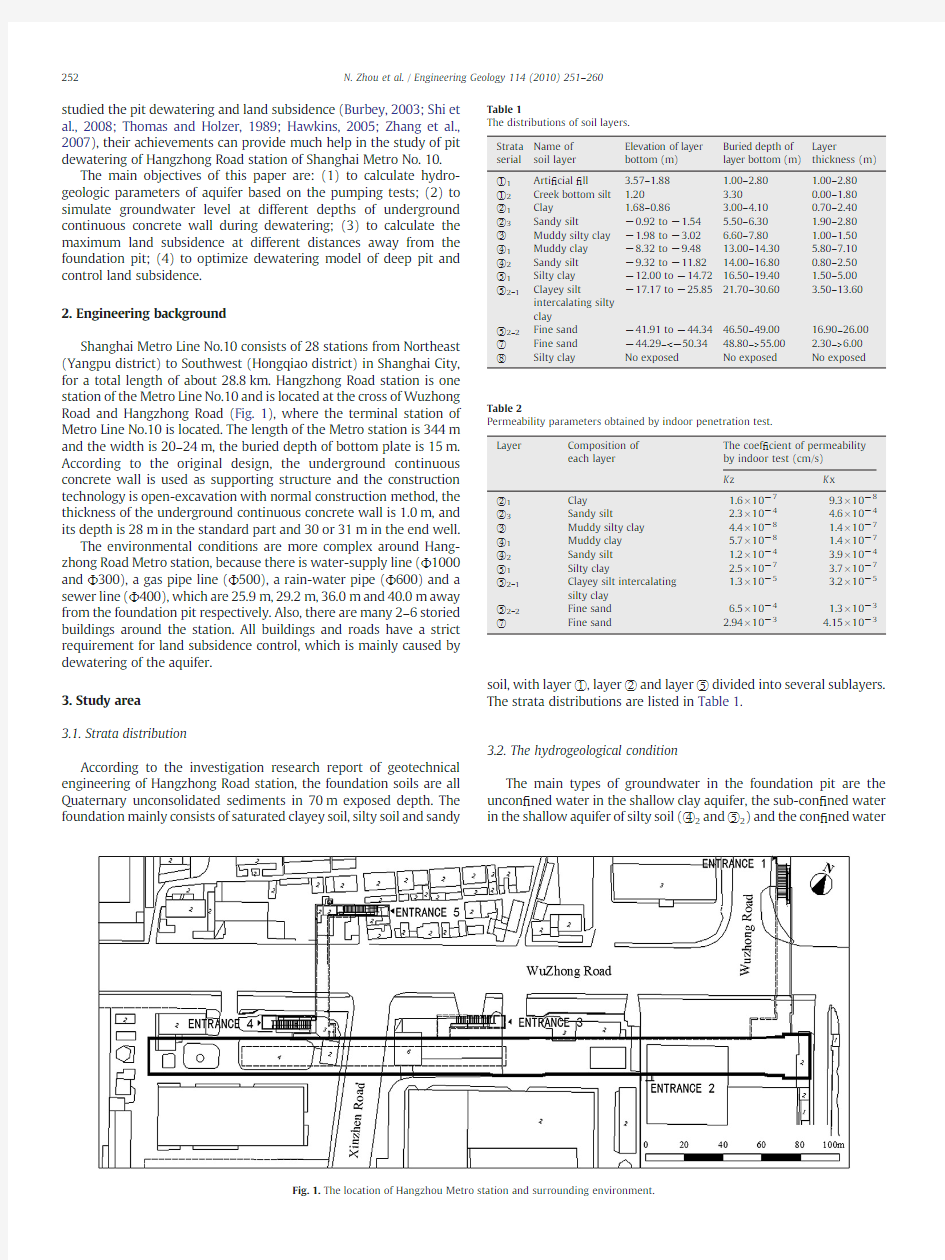
Shanghai Metro Line No.10consists of28stations from Northeast (Yangpu district)to Southwest(Hongqiao district)in Shanghai City, for a total length of about28.8km.Hangzhong Road station is one station of the Metro Line No.10and is located at the cross of Wuzhong Road and Hangzhong Road(Fig.1),where the terminal station of Metro Line No.10is located.The length of the Metro station is344m and the width is20–24m,the buried depth of bottom plate is15m. According to the original design,the underground continuous concrete wall is used as supporting structure and the construction technology is open-excavation with normal construction method,the thickness of the underground continuous concrete wall is1.0m,and its depth is28m in the standard part and30or31m in the end well.
The environmental conditions are more complex around Hang-zhong Road Metro station,because there is water-supply line(Φ1000 andΦ300),a gas pipe line(Φ500),a rain-water pipe(Φ600)and a sewer line(Φ400),which are25.9m,29.2m,36.0m and40.0m away from the foundation pit respectively.Also,there are many2–6storied buildings around the station.All buildings and roads have a strict requirement for land subsidence control,which is mainly caused by dewatering of the aquifer.
3.Study area
3.1.Strata distribution
According to the investigation research report of geotechnical engineering of Hangzhong Road station,the foundation soils are all Quaternary unconsolidated sediments in70m exposed depth.The foundation mainly consists of saturated clayey soil,silty soil and sandy soil,with layer①,layer②and layer⑤divided into several sublayers. The strata distributions are listed in Table1.
3.2.The hydrogeological condition
The main types of groundwater in the foundation pit are the uncon?ned water in the shallow clay aquifer,the sub-con?ned water in the shallow aquifer of silty soil(④2and⑤2)and the con?ned
water
Table1
The distributions of soil layers.
Strata
serial
Name of
soil layer
Elevation of layer
bottom(m)
Buried depth of
layer bottom(m)
Layer
thickness(m)
①1Arti?cial?ll 3.57–1.88 1.00–2.80 1.00–2.80
①2Creek bottom silt 1.20 3.300.00–1.80
②1Clay 1.68–0.86 3.00–4.100.70–2.40
②3Sandy silt?0.92to?1.54 5.50–6.30 1.90–2.80
③Muddy silty clay?1.98to?3.02 6.60–7.80 1.00–1.50
④1Muddy clay?8.32to?9.4813.00–14.30 5.80–7.10
④2Sandy silt?9.32to?11.8214.00–16.800.80–2.50
⑤1Silty clay?12.00to?14.7216.50–19.40 1.50–5.00
⑤2–1Clayey silt
intercalating silty
clay
?17.17to?25.8521.70–30.60 3.50–13.60
⑤2–2Fine sand?41.91to?44.3446.50–49.0016.90–26.00
⑦Fine sand?44.29–b?50.3448.80–N55.00 2.30–N6.00
⑧Silty clay No exposed No exposed No exposed
Table2
Permeability parameters obtained by indoor penetration test.
Layer Composition of
each layer
The coef?cient of permeability
by indoor test(cm/s)
K z K x
②1Clay 1.6×10?79.3×10?8
②3Sandy silt 2.3×10?4 4.6×10?4
③Muddy silty clay 4.4×10?8 1.4×10?7
④1Muddy clay 5.7×10?8 1.4×10?7
④2Sandy silt 1.2×10?4 3.9×10?4
⑤1Silty clay 2.5×10?7 3.7×10?7
⑤2–1Clayey silt intercalating
silty clay
1.3×10?5 3.2×10?5
⑤2–2Fine sand 6.5×10?4 1.3×10?3
⑦Fine sand 2.94×10?3 4.15×10?3 252N.Zhou et al./Engineering Geology114(2010)251–260
in the deep aquifer of ?ne sand soil ⑦.The water level (reference level is the sea level of Yellow Sea)of the uncon ?ned water is usually 0.3–1.4m below the ground surface and its elevation is 3.11–4.22m.The buried depth of water level of layer ④2and layer ⑤2sub-con ?ned water is 3.3m and 4.8m (March 31,2006)respectively,which is usually lower than that of the uncon ?ned water.The sub-con ?ned water in layer ⑤2is connected with the con ?ned water layer ⑦on the ?eld.The groundwater level is in ?uenced by season and climate.
Table 2shows the results of the indoor penetration test for aquifers ②1,②3,③,④1,④2,⑤1–1,⑤2–1,⑤2–2and ⑦.The excavating depth of foundation pit is 15.60–17.60m,the bottom plate of pit is located at ④2and ⑤1,which are the main objective aquifers for dewatering.Aquifer ⑤2–2mainly consists of ?ne sand with high water head and needs depressurizing.In order to simulate dewatering of foundation pit,the accurate permeability coef ?cient of layer ⑤2is obtained by the ?eld pumping test.4.Field pumping tests
Based on the primary design,the depth of the underground continuous wall is 28m in the standard part.The layout of pumping wells is in a triangle as shown in Fig.2.The spacing between them is 15m.The depths of pumping wells S1,S2and S3are 27,37and 23m respectively,while that of the ?lter tube in each well is from 19to
26m,31–36and 19–22m respectively.The depth of observation well S4is 35m,while the ?lter tube is from 31to 34m.The ?eld pumping tests include single-well and multiple-well pumping tests.Three single-well pumping tests were carried out from January 22to 30,2007;multiple-well pumping tests began from February 2,2007and ?nished on February 6,2007.The objective layer for pumping tests is layer ⑤2.In order to determine the single-well pumping rate and the permeability coef ?cient in aquifers ⑤2–1and ⑤2–2.The water level and hydraulic connection between ⑤2–1and ⑤2–2are measured in wells S1and S3in aquifer ⑤2–1,and in S2and S4in aquifer ⑤2–2.
The results of single-well pumping test and multiple-wells pumping test are shown in Fig.3.
The results of pumping tests show that the single-well pumping rate of layer ⑤2–1and ⑤2–2are 7m 3/d and 50–80m 3/d respectively,the water yield of the ?lter is 16m 3/d in layer ⑤2–2.
5.Three-dimensional numerical simulation of groundwater ?ow To obtain the hydrogeological parameters of aquifer ⑤2,the three-dimensional numerical simulation is carried out based on the results of the ?eld pumping tests combined with the strata distribution.The ?nite difference method (FDM)(Wang et al.,2009)is adopted.According to the in ?uence radius of many pit dewatering projects in Shanghai,the numerical simulation range extends 1000m along each side of foundation pit boundary,so the whole calculation area
is
https://www.docsj.com/doc/8512302985.html,yout of pumping
wells.
253
N.Zhou et al./Engineering Geology 114(2010)251–260
2347m×2020m.As the thickness of layer ⑤2–1is great,the latter is divided into two layers.In the vertical direction,a depth of 55m below the ground surface is considered,there are 12zones with different parameters (Fig.4).In the foundation pit area,the subdivision material is of increasing density.Therefore the whole calculation area is divided into 14layers,89rows,146columns,181,916units (Fig.5).
The
Fig.4.Parameter section zoning of discrete
model.
Fig.5.Three-dimension ?nite difference
model.
254N.Zhou et al./Engineering Geology 114(2010)251–260
interpolation method is used to calculate values according to the strata distributions of boreholes ZD1G1,ZD1G6and ZD1G8.To ensure the consistency and rationality of the result of the numerical simulation,both the analysis model and analysis model are used in the same discrete grids on the basis of the geotechnical exploration.The initial head of each unit is obtained from the ?eld observation results.The boundary conditions of the model are de ?ned as constant head boundaries.The bottom plate of layer ⑧is de ?ned as an impervious boundary.
S1and S3single well pumping test data are used to calculate and revise aquifer ⑤2–1parameters,and the hydraulic parameters of layer ⑤2–2are determined by S2pumping and S4observations.The 3D mathematical model of con ?ned aquifer unsteady ?ow is as follows:
??x k xx ?h ?x
+??y k yy ?h ?y +??z k zz ?h ?z ?W =S s ?h ?t ???ex ;y ;z T∈Ωk xx ?h ?n x +k yy ?h ?n y +k zz ?h ?n z j
Γ2=q ex ;y ;z ;t T???????ex ;y ;z T∈Γ2h ex ;y ;z ;t Tj t =t 0=h 0ex ;y ;z T?????????????ex ;y ;z T∈Ω
8>>>>>>><
>>>>>>>:
e1Twhere:k xx ,k yy ,k zz are the permeability parameters along x ,y and z directions (m/d);h is water head (m);W is the source and sink (1/d);S s is speci ?c storage (1/m);t is time (d);Ωis time domain;Γ2is the second boundary condition;n x ,n y and n z are the unit normal vector on boundary S 2along x ,y and z axis;q is lateral recharge per unit area on S 2(m 3/d).
During the parameter revision,the error is analyzed (Fig.6).The simulation results show that the calculated water head is comparable with that of the observation wells.
After the three-dimensional FDM simulation,the permeability coef ?cient of layer ⑤2which is obtained from the ?eld pumping tests is modi ?ed by ?tting the calculated value to the observation value (Table 3).The simulated results are all less than the indoor results.6.Three-dimensional numerical simulation of foundation pit dewatering
6.1.Dewatering scheme design of foundation pit
To ensure the stability of bottom plate of foundation pit,the soil pressure from the bottom plate of foundation pit to the top plate of con ?ned aquifer should be greater than the uplift force of con ?ned aquifer.According to the investigation report,the buried depth of water level of layer ⑤2sub-con ?ned is 4.80m,elevation is ?0.10m.The stability of bottom plate of foundation pit is calculated on the basis of three boreholes (ZD1G1,ZD1G5,ZD1C7).The buried water level must be below 1m under the bottom plate before excavation.The depressurizing requirements of foundation pit listed in Table 4,which shows that the water head of layer ⑤2sub-con ?ned water needs depressurizing during the pit excavation.According to the design of the enclosure structure of the foundation pit,27depressurizing wells (Y1–Y27)are arranged in
Table 3
Reversed permeability parameter of Layer ⑤2for numerical https://www.docsj.com/doc/8512302985.html,yer Composition of
each layer
Calculation model Initial coef ?cient of permeability (cm/s)
K x
K y
K z
⑤2–1Clayey silt intercalating silty clay Unsteady
?ow 2.1×10?5 2.1×10?5 1.02×10?5⑤2–2
Fine sand Unsteady
?ow
4.3×10?4 4.3×10?4 1.66×10?5
Table 4
Depressurizing for foundation pit stability (layer ⑤2–1sub-con ?ned water).Location of excavation Excavation depth (m)Depressurizing Depth (m)Buried depth of water level control (m)Water level control (m)West end
well (1–2axis)17.52413.72418.524?13.82Standard part (2–13axis)15.59010.18014.980?10.28Standard part (13–22axis)15.59011.10015.900?11.20Standard part (22–42axis)15.59010.18014.980?10.28East end well (42–44axis)
16.835
11.900
16.700
?
12.00
255
N.Zhou et al./Engineering Geology 114(2010)251–260
primary design,the depths of some depressurizing wells are adjusted based on the results of pumping tests,the depths of wells Y1–Y24are changed into 32m,and wells Y25–Y27are 28m.At the same time,three wells (GB1–GB3)are arranged for observations and reserve well in the pit,while the depths of GB1and GB2are 28m,the depth of GB3is 30m.Another well GB4is outside the pit,with depth of 28m.6.2.Selection of foundation pit dewatering
The calculation is carried out after the depressurizing design change,and depressurizing of foundation pit is calculated in accordance with 100d.Four schemes are included as follows:
(1)Scheme I:the depth of underground continuous concrete wall
is not adjusted.The bottom of ?lter pipe is 3m below the underground continuous concrete wall.The simulation results are shown in Figs.7and 8.
(2)Scheme II:the depth of underground continuous concrete wall
increases 3m,the bottom of ?lter pipe and the bottom of underground continuous concrete wall are located at the same level.The simulation results are shown in Figs.9and 10.
(3)Scheme III:the depth of underground continuous concrete wall
increases 4m,the bottom of ?lter pipe is 1m higher than the bottom of underground continuous concrete wall.The simula-tion results are shown in Figs.11and 12.
(4)Scheme IV:the depth of underground continuous concrete wall
increases 6m,the bottom of ?lter pipe is 2m higher than the bottom of underground continuous concrete wall.The simula-tion results are similar to scheme
III.
Fig.8.Water level contour of layer ⑤2–2around the curtain in 100days
depressurizing.
256N.Zhou et al./Engineering Geology 114(2010)251–260
The simulation results show that scheme I to IV can meet the depressurizing requirements,but the depressurizing ?lter tube exposed in scheme I can cause great drawdown outside the pit,the drawdown is more than 5m,while at the same time may induce more environmental engineering geological problems;in scheme II,the water level reaches the design drawdown in pit,when the drawdown is no more than 2m outside the pit,which means that it can effectively reduce the drawdown outside the curtain;scheme III and IV can effectively control the water level outside the foundation pit,their drawdown is no more than 1.2m outside the pit.Scheme III is the best depressurizing plan from technical and economic point of view.
7.Additional land subsidence calculations 7.1.Calculation method of land subsidence
The land subsidence caused by depressurizing or dewatering includes three parts:(1)immediate land subsidence (subsidence occurring elastic yield during pumping);(2)consolidation land subsidence (the steady state compaction of soil after stop pumping and water level keep stable);(3)secondary consolidation land subsidence owing to rheology of soil.Because the secondary consolidation land subsidence occurs after the end of primary consolidation,and needs loading for a long time,the
primary
Fig.10.Water level contour of layer ⑤2–2around the curtain in 100days
depressurizing.
257
N.Zhou et al./Engineering Geology 114(2010)251–260
consolidation land subsidence is mainly considered in calculation,while the layer-wise summation method is used in the calculation according to national code and standards.
The additional load of soil layer caused by dewatering can be calculated as follows:ΔP =γw h 1?h 2eT
e2T
where ΔP is the additional load of soil layer caused by dewatering (KPa);h 1is the height of water head in the soil layer before dewatering (m);h 2is the height of water head in the soil layer after dewatering (m);γw is water speci ?c weight (KN/m 3).
The additional land subsidence caused by dewatering can be evaluated by using the layer-wise summation method as follows:
S =U ∑n i =1
S i =∑
n i =1
ΔP i
i H i
e3T
where S is the total additional land subsidence caused by dewatering (m);U is consolidation degree of soil layer;S i is calculated soil layer
additional subsidence value (m);ΔP i is the additional load of calculated soil layer caused by dewatering (KPa);E i is compression modulus of the calculated soil layer (KPa);H i is the soil layer thickness of the calculated soil (m).
https://www.docsj.com/doc/8512302985.html,nd subsidence based on observation wells and drawdown The layer-wise summation method is utilized to calculate the land subsidence caused by dewatering.In order to study the effects of foundation pit depressurizing to the surrounding environment,85observation wells are set up with a distance of 5,10,20and 40m away from the underground continuous wall (Fig.13),while points G5,G10,G20and G40represent the distance of 5m,10m,20m and 40m away from the pit boundary respectively,and they are all located at layer ⑤2–1.Observation points of water level are set up in layer ⑤2–1,⑤2–2,⑦.These observation records can calibrate the simulation results.
After 100days depressurizing,the consolidation degree of layers ⑤2–1,⑤2–2and ⑦are listed in Table 5
.
Fig.12.Water level elevation of layer ⑤2-2around the curtain in 100days
depressurizing.
258N.Zhou et al./Engineering Geology 114(2010)251–260
8.Calculation results and discussion
The results correspond to the depressurizing schemes,and the calculation of land subsidence mainly considers the situation of
scheme I,scheme II and scheme III according to formula(3).
8.1.Case I
Based on the optimized depressurizing design,and since there is hydraulic connection among layer⑤2–2and layer⑦with layer⑤2–1, depressurizing calculation in layer⑤2–1is in according to the strata data of borehole ZD1G8combined with the drawdown observation value of layer⑤2–1,layer⑤2–2,and layer⑦1.The calculation results of land subsidence corresponding the scheme I are listed in Table6, which shows that the maximum drawdown reaches9.27m and 4.68m with a distance5m and40m away from the foundation pit.If the land subsidence above layer⑤2is not considered,the maximum land subsidence reaches43.42mm and31.32mm respectively.There will be a great impact to the surrounding buildings,pipelines,etc. 8.2.Case II
The calculation results of land subsidence that correspond to the scheme II depressurizing plan are listed in Table7,which shows that the maximum drawdown reaches3.16m and1.60m with a distance 5m and40m away from the foundation pit.If the land subsidence above layer⑤2is not considered,the maximum land subsidence reaches14.49mm and11.25mm respectively.It can reduce the impact effectively to the surrounding buildings,pipelines,etc.
8.3.Case III
The calculation results of land subsidence that correspond to the scheme II depressurizing plan are listed in Table8,which shows that the maximum drawdown reaches1.15m and0.67m with a distance 5m and40m away from the foundation pit.If the land subsidence above layer⑤2is not considered,the maximum land subsidence reaches7.97mm and548mm respectively.Con?ned water depres-surizing can control the impact effectively to the surrounding buildings,pipelines.
8.4.Monitoring results of land subsidence during the pumping test
In-situ pumping tests were carried out and a variety of land subsidence data is obtained from January22to February6,2007 (Fig.14).The monitoring data show that the maximum land subsidence of house,water supply pipes and ground surface are about2.5mm, 4mm and3.5mm respectively.The data can be used as basis to calculate and control land subsidence.
9.Conclusions
A case study on Shanghai Hangzhong Road Metro station is presented in this paper.According to the results of the?eld pumping tests,a three-dimensional numerical model is applied to obtain the permeability coef?cient of layer⑤2–1and⑤2–2by the method of FDM and that is the basis of the forward analysis for the hydraulic barrier function of the underground continuous concrete wall.
According to the results of the three-dimensional numerical simulation analysis,when the depth of underground continuous concrete wall is not adjusted,the bottom of?lter pipe is3m below the underground continuous concrete wall,the drawdown is more than 5m outside the pit,it may induce more environmental engineering geological problems;when the depth of underground continuous concrete wall increases3m,4m and6m respectively,and the position of?lter pipe is not changed,the drawdown are no more than 2m,1.2m and1.2m outside the pit respectively.So the depth of the underground continuous wall of the foundation pit for Hangzhong Road Metro station should increase on the primary design,with the increase of depth of the underground continuous concrete wall,the drawdown outside the pit decreases.When the underground continuous concrete wall increases4m,the simulated results indicate that the water level reaches the design drawdown in pit,while the
Table5
The consolidation degree of soil layer after100days pumping or dewatering.
Strata Void
ratio Consolidation
coef?cient
Thickness of
stratum
Time
factor
100d Consolidation
degree
e C v H(m)Coef?cient Time
factor
⑤2–10.979 1.71 3.50.1413.96 1.00
⑤2–20.829 4.0026/20.02 2.37 1.00
⑦0.75829.77 5.50.9898.42 1.00
Table6
Case II:land subsidence calculation.
Distance to
the pit
boundary
Number Drawdown(m)Land subsidence
(m)⑤2–1⑤2–2⑦(mm)
5m Min G5-12 2.00 2.12 2.18 2.36 1.320.7516.30 Max G5-19 5.277.399.27 6.18 2.570.9743.42
10m Min G10-12 1.95 2.05 2.09 2.15 1.270.7415.74 Max G10-19 5.217.028.10 5.87 2.530.9741.55
20m Min G20-17 1.80 1.82 1.81 1.70 1.130.7214.11 Max G20-24 5.00 6.14 6.44 5.20 2.420.9637.80
40m Min G40-14 1.47 1.42 1.39 1.290.950.6811.56Table7
Case II:land subsidence calculation.
Distance to
the pit
boundary
Number Drawdown(m)Land subsidence
(m)⑤2–1⑤2–2⑦(mm)
5m Min G5-120.810.97 1.09 1.590.690.327.78
Max G5-18 1.55 1.95 2.22 3.16 1.220.4014.49
10m Min G10-130.800.93 1.00 1.170.630.317.25
Max G10-18 1.54 1.91 2.15 2.80 1.190.4014.13
20m Min G20-170.740.810.840.880.500.30 6.18
Max G20-23 1.50 1.81 1.96 2.26 1.100.4013.22
40m Min G40-140.590.610.610.590.430.28 4.98
Max G40-27 1.37 1.52 1.58 1.600.920.3911.25
Table8
Case III:land subsidence calculation.
Distance to
the pit
boundary
Number Drawdown(m)Land subsidence
(m)⑤2–1⑤2–2⑦(mm)
5m Min G5-240.330.380.420.460.710.19 4.98
Max G5-180.520.630.680.76 1.150.247.97
10m Min G10-240.320.370.400.440.630.19 4.58
Max G10-180.520.620.680.76 1.150.247.96
20m Min G20-170.310.350.370.390.460.18 3.75
Max G20-230.510.600.640.700.910.24 6.84
40m Min G40-10.250.270.280.280.290.16 2.66
259
N.Zhou et al./Engineering Geology114(2010)251–260
drawdown outside the pit is less than 1.20m at a distance of 1–5m to the wall,hence the drawdown outside the foundation pit can be controlled effectively to meet the requirement of dewatering.
The dewatering of the aquifer during the foundation pit construc-tion of the Metro station may cause land subsidence and other poor environment geologic problems.After the dewatering design scheme is optimized,the maximum land subsidence outside the foundation pit is 7.97mm,which is nearly of no in ?uence on the environment around the pit during dewatering.The equal drawdown test indicates that the predicted value of the three-dimensional FDM model has a good agreement with the monitored value and it can lead to solutions for similar projects.Acknowledgments
This study was supported by the scholarship from the Ministry of Baden —Württemberg in Germany,the National Natural Science Foundation of China (No.40872178)and Kwang-Hua Fund for College of Civil Engineering,Tongji University.Authors would thank Prof.Bernhard Westrich,who gave much help to in writing this paper.Authors should also thank the Institute of Geotechnical Engineering of University of Stuttgart that supplied the good working conditions.References
Burbey,T.J.,https://www.docsj.com/doc/8512302985.html,e of time-subsidence data during pumping to characterize speci ?c
storage and hydraualic conductivity of semi-con ?ning units.Journal of Hydrology 281,3–22.
Dassargues,A.,Biver,P.,Monjoie,A.,1991.Geotechnical properties of the Quaternary
sediments in Shanghai.Engineering Geology 31,71–90.
Hawkins,A.B.,2005.Subsidence.Engineering Geology.Charlotte House,Bristol,UK,pp.9–14.Luo,Z.J.,Zhang,Y.Y.,Wu,Y.X.,2008a.Finite element numerical simulation of three-dimensional seepage control for deep foundation pit dewatering.Journal of Hydrodynamics 20(5),596–602.
Luo,Z.J.,Liu,J.B.,Li,L.,2008b.Three-dimensional full coupling numerical simulation of
groundwater dewatering and land-subsidence in quaternary loose sediments.Chinese Journal of Geotechnical Engineering 30(2),193–198(in Chinese with an English Abstract).
Shi,X.Q.,Wu,J.C.,Ye,S.J.,et al.,2008.Regional land subsidence simulation in Su-Xi-Chang
area and Shanghai City,China.Engineering Geology 100,27–42.
Thomas,Holzer,L.,1989.State and local response to damaging land subsidence in
United States urban areas.Engineering Geology 27,449–466.
Wang,G.G.,Yan,P.,Gong,X.N.,2001.Research on the seepage ?eld of excavation with
waterproof structure.Ind.Constr.31(4),43–45.
Wang,J.X.,Hu,L.S.,Wu,L.G.,Tang,Y.Q.,Zhu,Y.F.,Yang,P.,2009.Hydraulic barrier
function of the underground continuous concrete wall in the pit of Metro station and its optimization.Environmental Geology 57,447–453.
Wu,L.G.,Liu,S.N.,Li,H.R.,Yao,Yin,2003.Design and Execution of Dewatering of &
Theory of Seepage in Deep Excavation.China Communication Press,Beijing.(in Chinese).
Wu,L.G.,Li,G.,Fang,Z.C.,Lou,R.X.,2009.Dewatering Case History for Excavation.China
Communication Press,Beijing.(in Chinese).
Yu,H.L.,Lu,J.F.,Li,S.D.,2002.Study on seepage ?eld characteristics of foundation pit
excavation.J Zhejiang Univ China (Science Edition)29(5),595–600(in Chinese with an English Abstract).
Zhang,Y.,Xue,Y.Q.,Wu,J.C.,Ye,S.J.,Wei,Z.X.,Li,Q.F.,Yu,J.,2007.Characteristics of
aquifer system deformation in the Southern Yangtse Delta,China.Engineering Geology 90(3–4),160–
173.
https://www.docsj.com/doc/8512302985.html,nd subsidence of ground and water supply line during the pumping test.
260N.Zhou et al./Engineering Geology 114(2010)251–260